Efrat Vilenski
Ph.D. candidate at Dept. of Industrial Engineering at Ben Gurion University,
Supervised by Dr Jonathan Rosenblatt.
My research focuses on visual analytics of unsupervised multivariate anomaly detection algorithems.
With focus on industrial IoT use cases, creating dashboards combining power of data pre-processing with machine learning methods and interactive visualizations.
I am interested in solving real-world complex data problems. Creating systems, incorporating ideas and algorithms from several fields such as multivariate statistics, robust statistics, process control, machine learning and network analysis.
Featured Projects
 MultiNav R package
Challenge: Efficient exploratory data analysis and anomaly detection of multivariate data.
Scope: Process data streams, compute multivariate summaries and create interactive displays.
Links: [Github] [Documentation].
Note: To get updates on packadge development news - Subscribe to MultiNav Mailing list.
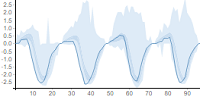
 Agriculture Sensors Anomaly Detection - Use Case
Challenge: Identifying outliers in highly correlated sensor streams, to ensure decisions are made only based on quality data.
[Published paper].
Scope: Evaluating several multivariate methods for anomaly detection and relevant visualizations.
Visualizations: Sensors data exploration: [Demo] | Anomaly scores comparison [Demo]
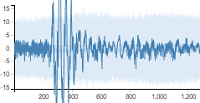
 Bearing Malfunctions - Use Case
Challenge: Bearing process control and diagnostics by usage of high frequency vibration sensors.
Scope: TBD. Collaboration with Bortman lab.
Visualizations: Vibration sensors exploration: [Demo 1] | [Demo 2]
Data Visualizations Playground
Multivariate Data Visualizations

Collection of techniques to visualize and explore data sets with many variables. [Link]
D3.js Blocks
Simple snippets to demonstrate ideas or to facilitate learning's. [Link]
Interactive charts in R

Collection of links and code examples for a session on interactive charts @ Israel R user Group
[ Link ]
Interactive charts in JS

Presenation of javascript interactive charts tricks to accompany invited talks.
[ Link ]
Spirograph Math Art

Art based on geometrical shapes created with mathematical functions.
[ Link ]
Work Experience
| 2017 - Now | Ben-Gurion University / Industrial Engineering | |
| Teaching: Introduction to Databases & Introduction to Business Intelligence & Data Mining | ||
| 2017 - Now | Volcani Center |  |
| Data Research, PLF Lab | ||
| 2016 - 2017 | Phytech | |
| Data Scientist | ||
| 2003-2015 | Intel |  |
| Automation Engineer and Data Analyst |